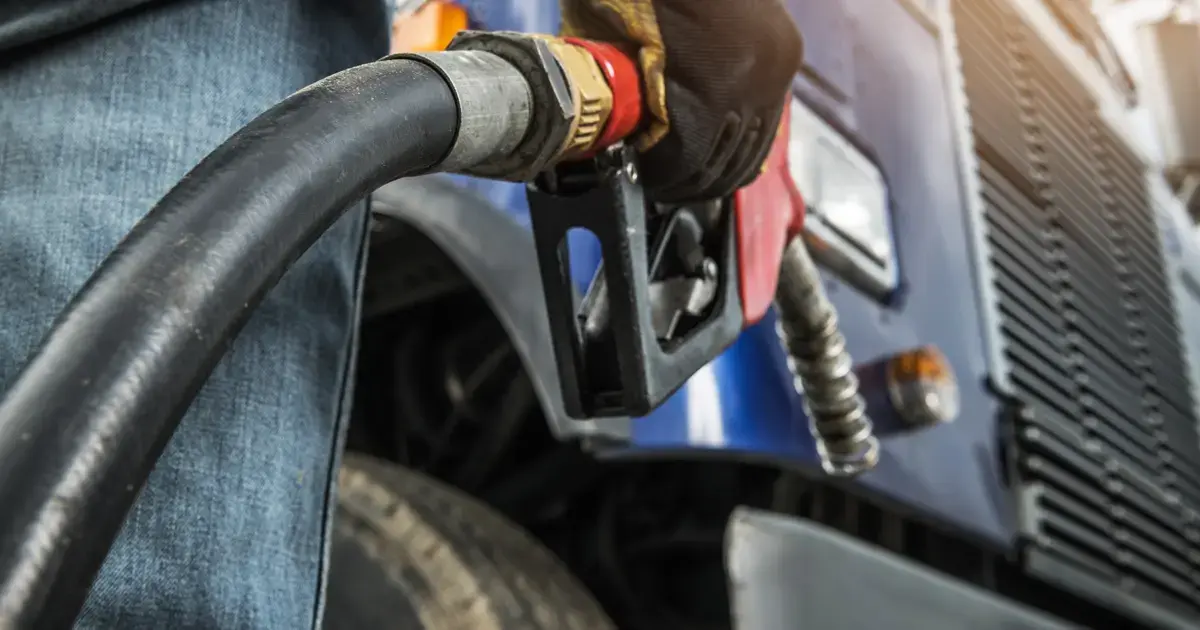
The war in Iran has sent fuel prices up more than 40% since February 2026 and then back down 15% due to a ceasefire.
Summary
The war in Iran has sent fuel prices up more than 40% since February 2026 and then back down 15% due to a ceasefire. With the constant fuel price volatility, fleet managers are in flux as they try to budget. This blog post breaks down how fleet managers can reduce fuel costs by identifying fuel waste, and how telematics and fleet management tools can help.
Read time: 4 minutes
Why are fleet fuel costs rising and dropping so fast right now?
You've seen it at the pump. Since the war in Iran began February 28, 2026, prices increased, forcing fleet managers to rethink their budgets mid-year. As of April 6, 2026, diesel prices jumped to a national average of $5.64 a gallon, up nearly 55% from the same time in 2025. Gas prices went up to $4.12 per gallon, up nearly 30%. The International Energy Agency has called it the largest energy supply disruption in the history of the global oil market.
And then just as quickly, fuel costs plummeted.
On April 7, a two-week ceasefire was reached, and global oil prices dropped nearly 15%. However, analysts say the oil market remains extremely tight, infrastructure damage could take years to repair, and the uncertainty itself has become a cost. Teams now have to reshape how fleets budget and plan for 2026.
The cause is the Strait of Hormuz, a narrow waterway between Iran and Oman through which roughly 20% of the world's oil supply travels every day. Due to the war, Iran effectively shut it down. Ships stopped crossing, and producers in the Gulf ran out of storage.
Fuel prices are volatile, and no one knows when they’ll settle.
Fleet management teams have seen spikes in fuel in the past, sanctions on Russian oil in 2022, the financial crisis of 2008… global events that ripple quickly to the pump. It’s clear, you can't control what happens in the Strait of Hormuz, but you can control how much fuel your fleet wastes.
Right now, that distinction is the difference between a budget that holds and one that doesn't.
Why does this hit school and public sector fleets differently?
For-hire trucking carriers have a lever most public fleets don't. They can raise rates or attach fuel surcharges to offset what they spend at the pump.
Meanwhile, your public fleet fuel budgets are set. Your routes are fixed. And the board meeting is next month.
There's another layer of complexity specific to your duty cycle. A school bus or a municipal utility truck doesn't operate like a highway semi. It starts and stops dozens of times a day. It idles, sometimes necessarily, sometimes not.
Many telematics tools use GPS-based distance estimates to calculate fuel consumption, which is notoriously inaccurate for the kind of stop-and-go cycles your vehicles run. That means the fuel data you're looking at may not reflect reality. And if it doesn't, you can't make a credible case to your board, your budget office, or a public auditor that you've done everything possible to manage costs.
The answer sometimes defaults to a manual audit or a reminder to turn engines off. But it doesn’t have to. High-fidelity data pulled directly from the engine control module provides evidence for making strategic decisions about fuel usage.
And this data is the only data that holds up under scrutiny.
How do you reduce fleet fuel costs? Start with what you can measure.
Fuel waste doesn't look like one big problem. It looks like five smaller ones, each hiding in a different part of your operation.
Understanding what's driving waste is your first step toward doing something about it.
1. Idling, the most visible fuel waste most fleets deal with
Conversations around idling usually stops at "turn the engine off." That's not useful for a school bus driver waiting at a railroad crossing in January with 40 kids on board.
The real challenge is distinguishing necessary idling from waste and reducing unnecessary idling time. And it is a massive cost saving opportunity. According to the Ecology Center, unnecessary idling consumes 3.8 million gallons of fuel per day. In many industries, engines run for legitimate reasons, including heating and cooling for student safety, waiting at school dismissal, and pre-trip warmup in cold climates. But those same operational needs cover a lot of unnecessary idling. For instance, the U.S. EPA recommends no more than three to five minutes of idling to warm up a school bus engine.
Without time-stamped, location-specific idle data, you can't tell the difference between acceptable and unacceptable idling. And without that distinction, any conversation with a driver about idling becomes a general complaint rather than a specific, coachable moment.
Your goal isn't zero idling. Instead, understand which idle events serve an operational purpose and which ones don't.
Idling waste isn't unique to school buses.
Field service trucks run at jobsites for hours, powering equipment or waiting between calls. Municipal and public works vehicles idle through work zones and staging areas in ways that feel routine until you calculate the cost across a full fleet. The duty cycles differ, but the problem is the same: without location and duration specific idle data, there's no way to separate necessary engine-on time from waste and no foundation for a policy that changes behavior.
A useful framework is to categorize idle events using an idle report in your fleet management software by location, duration, and time of day. Idling at a school 20 minutes before the bell is a different conversation than idling at a depot for the same time frame. Duration matters too. A two-minute idle at a crossing is operationally defensible while a 45-minute idle parked at a driver's house is not.
2. Driver behavior reduces fleet fuel costs
Fuel economy studies consistently show aggressive driving reduces efficiency 15-30% at highway speeds and 10-40% in stop-and-go conditions. But "aggressive driving" is a vague term that doesn't give drivers or fleet managers anything specific to work with.
The more useful lens is throttle management, or specifically, how a driver applies acceleration relative to what the route and load require.
Hard acceleration from a stop burns more fuel than gradual acceleration to the same speed. Frequent braking followed by hard re-acceleration (common in stop-and-go routes) compounds the waste. Over hundreds of route cycles, small differences in throttle behavior add up to thousands of dollars in fuel spend.
What separates effective driver coaching from general awareness campaigns is specificity. A driver told "you're using too much fuel" has nowhere to go with that feedback. Using a back-end fleet management reporting software such as Zonar ZFuel™ captures metrics on driver performance, trip length, route, vehicle and more can be shown specific scenarios to learn from. The driver’s actual trip can then be compared to an ideal route so fleet teams can identify inefficiencies and optimizations.
They can be shown "on Route 14, your fuel economy drops 18 percent between Oak Street and the high school due to acceleration patterns at three specific intersections" which has something actionable for the driver to take away from.
That specificity only comes from engine-level data, not GPS estimates, not manual observation.
Drivers who understand why their behavior affects fuel economy tend to change it more durably than drivers who are simply told to change it.
3. Mechanical issues drive fuel waste
Not all fuel waste is behavioral. Some of it lives entirely in the vehicle and is invisible until it becomes expensive.
Dragging brakes, clogged fuel filters, dirty fuel injectors, and failing emissions components can all degrade fuel economy significantly before a driver notices any change in performance. A vehicle running 8 to 12% below its expected fuel efficiency due to a mechanical issue looks, from the driver's seat, like a normal day of driving.
This is where the gap between GPS-estimated fuel data and engine-level data is consequential. A telematics system that estimates fuel consumption from distance traveled will show that vehicle as performing normally. A system reading directly from the engine control module will flag the discrepancy between expected and actual fuel burn alongside fault codes that point to the specific mechanical cause. The Department of Energy reports that fixing serious maintenance issues can improve fuel mileage by as much as 40%. Predictive maintenance platforms such as Zonar FaultIQ™ diagnose major issues before they present, further reducing issues with degraded fuel economy.
Fuel economy data should be part of the diagnostic conversation, not just mileage intervals. Whether the cause is a maintenance issue or a driver behavior shift, the trend is worth investigating before it becomes a repair bill.
4. Tire pressures impact on fuel costs
Tire pressure is a relatively simple mechanical variable, but its impact on fuel economy is real and continuous.
Research consistently shows that fuel economy drops approximately 0.2% for every 1 PSI a tire falls below its recommended pressure. That may sound small, but a tire running 10 PSI low, which is not an unusual condition for a vehicle that doesn't get daily pressure checks, reduces fuel economy by roughly 2% on that axle.
For a 50-vehicle fleet running daily routes, persistent under-inflation across even a portion of the fleet can represent a meaningful, entirely preventable fuel expense.
The challenge is inspection cadence. Manual tire pressure checks are easy to defer, easy to skip under time pressure, and easy to do inconsistently.
The more durable approach is systematic monitoring that catches pressure drops before they compound. It also creates a maintenance record that documents when tires were flagged and when they were corrected. And that’s the kind of paper trail that matters when you justify operational spending to a school board or city council.
5. Fuel theft drains your budget but how do you catch it?
When diesel is over $5 a gallon, the cost of unauthorized fuel use is an often overlooked line item in your budget.
Fuel theft in fleet operations typically doesn't look like someone siphoning a tank at night. It's more often structural: fuel cards used outside authorized routes, fill-ups that don't correlate with vehicle movement, or fuel purchased for a fleet vehicle that ends up in a personal one. Shell Fleet Solutions research found that fleets lose up to 5% of their annual fuel spend to misuse, and over 70% of fleet managers surveyed said reducing these costs is a top priority.
Misuse and theft persist because they’re hard to detect without the right cross-referencing. An isolated fuel card transaction looks legitimate. It only becomes anomalous when you layer in where the vehicle actually was at the time of purchase, how much fuel it would have needed based on miles driven, and whether the fill-up time and location are consistent with the assigned route.
Manual audits catch obvious cases, but they rarely catch patterns.
Understanding your fleet's fuel levels and knowing which vehicles consistently show a gap between fuel levels and miles driven is the baseline for both detecting misuse and deterring it.
Should rising fuel costs push your fleet toward EVs?
Fair question, and a complicated one. The Iran war has renewed interest in EV adoption across commercial and public sector fleets. But it's also created exactly the kind of budget uncertainty that makes large capital decisions harder to defend.
The Federal EV infrastructure funding (NEVI) has been cut by $900 million, and the uncertainty around charging grants continues to slow public sector fleet planning. Right now, that uncertainty is doing more damage to EV confidence than cost alone.
The practical answer is you don't have to choose between managing today's fleet and planning tomorrow's. Data generated from telematics tools, such as fuel consumption per vehicle, idle time, and cost per mile, forms the foundation for the business case behind an EV transition. Vehicles with the highest fuel spend are your strongest candidates for electrification.
How do you build a fleet fuel strategy that holds up to scrutiny?
School districts and municipalities operate in a different accountability environment than private carriers. Every gallon you burn is a taxpayer dollar. And when fuel costs spike, for any reason, the question boils down to "can you prove you're not wasting it?"
Standard fuel data can't answer that question.
When a school board or city council asks for justification, you need data-backed answers, such as engine-level data from a TCU such as the Zonar V4™.
A defensible fuel management strategy looks like this.
- Actual ECU fuel consumption data, not GPS estimates, reported by vehicle, route, and driver
- Idle time reports with contextual data to separate necessary from unnecessary engine-on time
- Fault and diagnostic data that connects mechanical health to fuel efficiency
- Fuel theft detection that cross-references fueling activity against vehicle location and movement
- A documented history of data-backed operational adjustments and evidence that the data led to action
When fuel prices are volatile, that infrastructure of good fleet management is how you meet the standard stakeholders expect.
Ready to see how we can help reduce your fleet fuel costs? Zonar hardware and software ecosystem gives fleet managers the high-fidelity data needed to find waste, defend budgets, and to build toward a smarter fleet. Talk to a Zonar expert today.